Wivenhoe Weather Station
Latitude N 51° 51' 34" Longitude E 00° 57' 58" Elevation 12 m
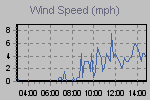
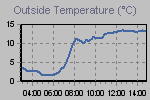
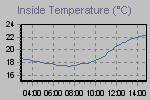
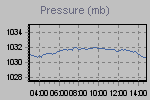
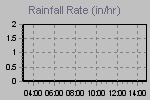
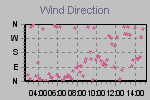
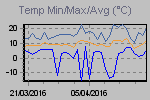
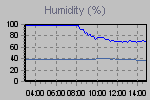
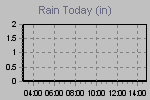
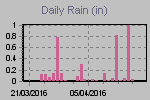
These graphs present the temperature, pressure, rainfall, and wind speed trends for the last 12 hours.
The thumbnail graphs are sampled every ten minutes. Click on a thumbnail to display the corresponding larger graph in the panel above it. The large graphs are sampled every minute.

| Click on a thumbnail to show a large graph in the panel above. | ||||
 |
 |
 |
 |
 |
 |
 |
 |
 |
 |
| :now::gauges::realtime::today::yesterday::records::trends::webcam::homeseer: | ||||
Page updated 20/04/2016 14:50:00
powered by
Cumulus v1.9.2 (1026)